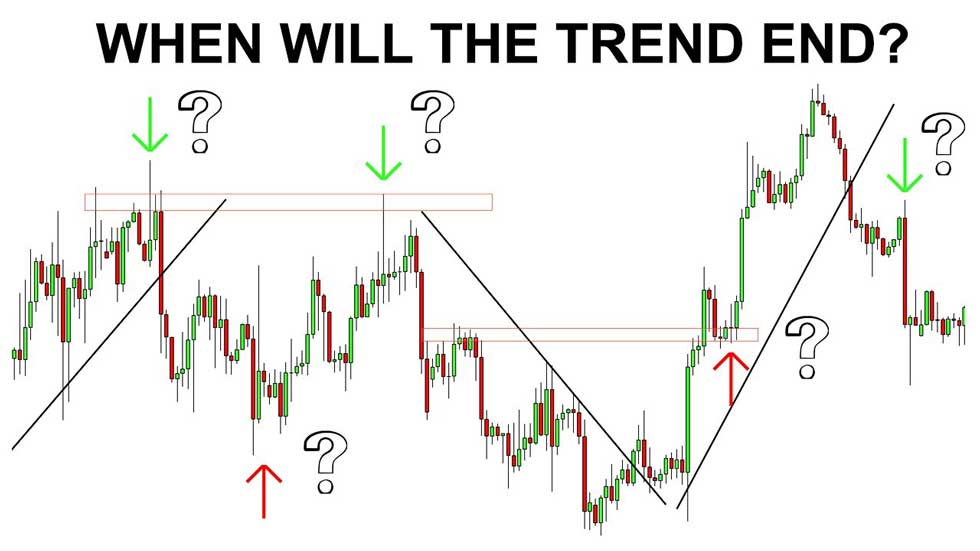
Technical analysis

RSI false signals

What is the difference between MACD and RSI?

Technical analysts and day traders frequently utilize the moving average convergence divergence (MACD) indicator and the relative strength index (RSI) as momentum indicators. Despite the fact that they both give traders signals, they function differently. What each is intended to measure is where the main differences between them reside. The MACD is mostly used to

What is the difference between MACD and RSI? Read More »

moving average convergence divergence ema confirmation macd

How To Use MACD Effectively

An oscillator of momentum, the Moving Average Convergence Divergence indicator is usually employed in trend trading. Despite being an oscillator, it is rarely employed to spot overbought or oversold positions. It shows as two lines that oscillate without boundaries on the graph. Similar to a two moving average technique, trading signals are generated by the

How To Use MACD Effectively Read More »

stag bollinger bands

How To Use Bollinger Bands In a Variety of Markets

John Bollinger created the Bollinger Bands in the 1980s as a technical analysis tool for trading equities. The bands make up a volatility indicator that calculates the price of an asset in proportion to past trades’ relative highs and lows. Standard deviation, which alters with volatility rises or decreases, is used to quantify volatility. When

How To Use Bollinger Bands In a Variety of Markets Read More »

channels trading

How to use channels to your advantage in trading a security

Technical indicators that identify areas of support and resistance are used in channel trading. This data can be used by traders to decide whether to start a buy or sell position and to gauge the level of market volatility at the moment. For reference, support and resistance are two different levels that seem to limit

How to use channels to your advantage in trading a security Read More »

pullback AMD

What is a pullback and how to use it to your advantage

A pullback is a dip or mild decline from recent peaks in a stock or commodity pricing chart that takes place during an upswing. The phrases “pullback” and “retracement” are sometimes used interchangeably since they are so similar to each other. The phrase “pullback” is typically used to describe price declines that last only a

What is a pullback and how to use it to your advantage Read More »

volume weighted moving average AMD

Volume Weighted Moving Average Indicator For Trading

A moving average that gives bars with large volume more weight than bars with light volume is called a volume weighted moving average. As a result of being volume weighted, the moving average’s value will be more in line with where the majority of trading really took place. Almost all moving average types can be

Volume Weighted Moving Average Indicator For Trading Read More »

amd support

What Is Support And Resistance And How To Find It

What is support and resistance? A ball falls to the ground and rebounds. It will fall after reaching the ceiling if you throw it up. Prices are positioned between support and resistance, which are similar to a floor and a ceiling. Price changes must be understood in the context of support and resistance. Depending on

What Is Support And Resistance And How To Find It Read More »

Scroll to Top