Technical analysts and day traders frequently utilize the moving average convergence divergence (MACD) indicator and the relative strength index (RSI) as momentum indicators. Despite the fact that they both give traders signals, they function differently. What each is intended to measure is where the main differences between them reside.
The MACD is mostly used to determine how strongly stock price movement is changing. By calculating the divergence of two exponential moving averages (EMAs), typically a 12-period EMA and a 26-period EMA, it achieves this. A line representing the nine-period EMA of that computation is shown over the MACD’s fundamental representation as a histogram. A MACD line is produced by subtracting the 26-period EMA from the 12-period EMA. Positive or negative values are provided for the MACD by a zero line. In essence, more space between the 12-period EMA and the 26-period EMA indicates more market movement, either up or down.
According to recent price levels, the RSI seeks to show whether a market is thought to be overbought or oversold. The average price gain and loss over a certain time period is calculated by the RSI; the default time period is 14 periods. On a scale from 0 to 100, the RSI values are plotted. Values over 70 are seen to be a sign of an overbought market in reference to current price levels, and values under 30 are thought to be a sign of an oversold market. Values above 50 are often seen as bullish, while readings below 50 are generally interpreted as bearish.
MACD
- Strength momentum
- Trend reversal
- Trend recognition
- Divergence
- Based on moving average
- Can range until infinity
RSI
- Overbought oversold
- Speed of change in price
- Divergence
- Can only range between 0 and 100
Basic use of the MACD
A nuanced approach to analysis can help you spot particularly strong momentum for large price swings that can swiftly produce profits—or losses, depending on which side of the price swing you’re trading on—when studying MACD to find trading opportunities.
The “golden cross” and the “death cross” are two important patterns that result from a MACD crossing. Although these patterns are almost mirror images of one another, recognizing them is essential to maximizing the potential of MACD in your trading strategy:
Golden cross: After a price decline accompanied by heavy selling, this bullish sign often observes a positive crossover. After the selloff is over, the price starts to rise, and the crossover occurs with strong upward momentum that pushes the price well over the crossover line, giving traders who recognized the prior drop a big profit.
Death cross: The opposite of a golden cross, it is a negative signal. As purchasers possibly overbought securities, prices rise, but once this demand is met, prices fall, creating a crossover with strong downward momentum.

Basic use of the RSI
A 100-point scale known as the “relative strength index” (RSI) shows the momentum of price changes for a particular forex currency pair. In order to readily distinguish overbought or oversold positions based on those momentum swings, this straightforward chart is separated into three sections.
Although RSI also tracks momentum, it does so using a distinct analytic method. By highlighting trade chances where a currency pair’s circumstances are either overbought or oversold, RSI can spot purchasing possibilities. RSI implies that when conditions are overbought, the price may be inflated and ready to fall.
When a security is oversold, the RSI shows that traders may have overreacted and have now generated value by lowering the price and demand.

Disadvantage of the RSI
The RSI indicator will offer us many false signals of oversold or overbought. If we would use the RSI as a standalone indicator, we would not make any money. Or only when we are lucky, and price is moving in a range where support equals oversold and resistance equals overbought. That won’t happen often. Therefore it is not recommended to use this as a standalone indicator. Another important disadvantage of the RSI indicator is that it can show us oversold or overbought for a long period of time. If for instance the market is having strong upwards momentum. The indicator will offer us many overbought signals, while the trend is definately not going to reverse.

In this case we would have shorted PEPSICO for five times until we get a winning trade the sixth time. Depending on our stoploss we could have still had a profit in total from those 6 trades. But I think it is clear that we cannot trust the RSI all by itself to decide wether we go long or short. That doesn’t mean it is a bad indicator. The gearbox of a car isn’t a bad thing, but it won’t make the car move by itself. It needs the engine and all the other parts. As with the RSI we need other confirmations that our signals are correct (support/resistance, moving average, MACD, ichimoku).
Using MACD and RSI together in trading
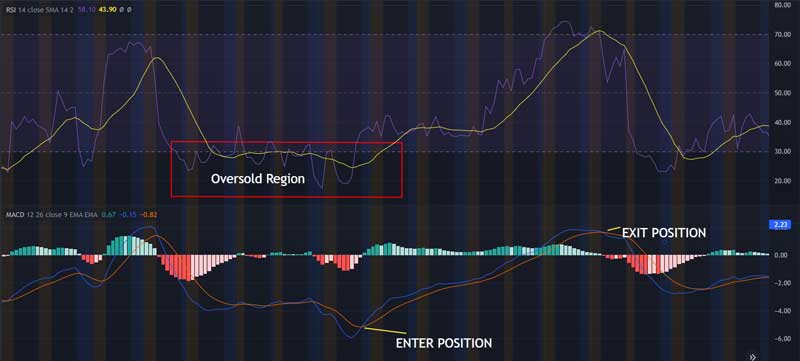
Here is an example on how we can use MACD indicator and RSI together to decide when we take a position and when we exit a position. In a perfect world this will offer us great results. Yet still with having those two confirmations, it is better to look for a third and fourth confirmation as for example two moving averages crossing or/and an important support and resistance level. Another way to confirm our position is to wait until the zero line of the MACD in the middle is crossed. The advantage is that we will filter faulty signals, the disadvantage is that we will only have a small portion of the move.
Summary
Both the MACD as the RSI are known to give us many signals. Many false signals, many good signals. It is our job to filter out the good ones from the bad ones. One way to confirm the MACD crossover is to look at the RSI. A way to confirm the RSI is to look for a MACD crossover. With 2 confirmations we can make a trade. If we want to be conservative we can wait for a third and forth or even fifth confirmation (support/resistance, moving average, ichimoku, general trend).