Japanese for “average bar,” Heikin-Ashi is often spelled Heiken-Ashi. When trading securities, the Heikin-Ashi approach can be used in conjunction with candlestick charts to identify market trends and forecast future prices. It helps make candlestick charts easier to read and trends simpler to analyze. Heikin-Ashi charts, for instance, can be used by traders to determine when to continue in transactions while a trend is present and exit when the trend pauses or reverses. The majority of earnings are made while markets are trending, thus accurately identifying trends is essential.
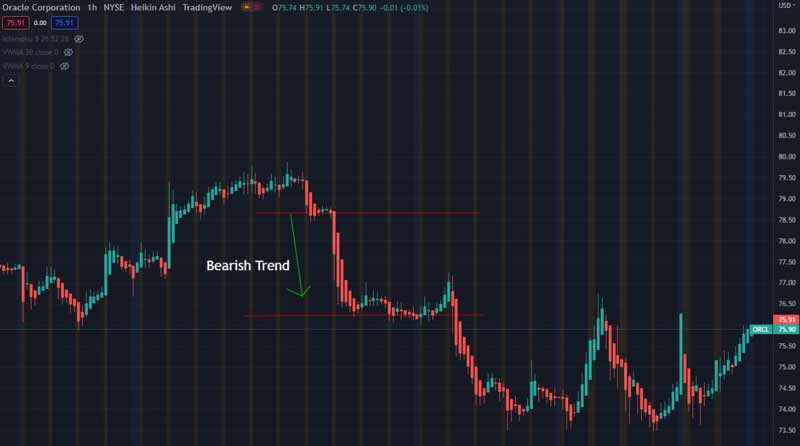
A Strong Bullish or Bearish Trend Starting to Emerge
The Heikin-Ashi approach is most frequently used to spot the start of a significant upward or downward trend. Heikin-Ashi signal indicators are frequently regarded as being quite accurate. Because of the Heikin-Ashi trend signal’s reliability, traders can effectively ride the trend. When a bullish trend starts to develop, traders should expand and consolidate their long bets while closing out short positions. The price may be about to fall down when the Heikin Ashi candle turns from green (bullish) to red (bearish). If you are currently long, you might wish to sell. You might want to increase your position if you’re currently short.
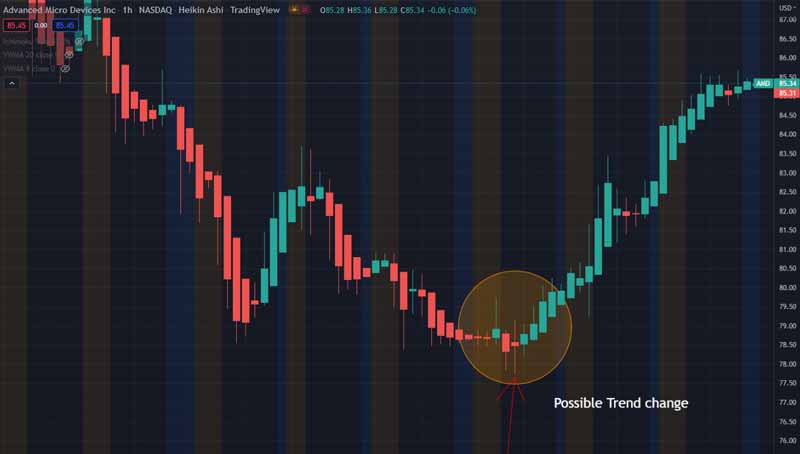
Small-Body Candlesticks Signal Trend Pauses or Reversals
The appearance of candles with little bodies is a tip for traders to pay attention to. When a trend is ready to pause or reverse, these candles are utilized as a warning. Consequently, traders move to establish fresh positions in response to a trend ending when they become aware of this. Trading, however, requires caution because the trend may be stalling rather than definitely reversing. In that instance, the trader’s ability is needed to distinguish between a trend pause and a real impending reversal.
Heikin-Ashi Technique advantages
Heikin-Ashi is one of the most easily accessible indicators because it doesn’t need to be installed and is available on all trading platforms.
Any trader may understand the candlestick patterns, making the chart simple to interpret. It is simpler to discern market patterns and movements because Heikin-Ashi candlesticks are easier to read than typical candlestick charts. Heikin-Ashi is a highly dependable indicator that produces accurate readings. It makes use of historical data, which is also quite trustworthy. The indicator lowers minor adjustments and filters out market noise, resulting in more visible signals.
The smoothing effect facilitates trend recognition. Today’s markets are noisy, therefore the Heikin-Ashi technique lets traders more effectively plan their entry and exit locations by using noise reduction. The Heikin-Ashi indicator can be used in conjunction with other technical indicators to provide stronger alerts regarding market action. The technique is applicable to all time frames, including hourly, daily, monthly, and yearly ones. Larger time frames, however, are more dependable.
Due to the strategy’s popularity, reputable brokers come standard with the software tools. Just choose the chart type, that’s all. There is a good probability of trading with the herd rather than against it because so many others are utilizing the approach. The candlesticks’ formula makes it simpler to identify trend direction and reversal, and because there are fewer of them, they tend to be more trustworthy. Similarly, Heiken Ashi methodologies-based methods are likewise less likely to show fictitious breakouts.
Heiken Ashi candlestick charts alternate bullish and bearish candles less frequently than traditional candlestick charts. Clearer indications result from this. A great approach to increase your revenues is to ride trends. Data demonstrates that retail traders frequently trade against trends and have a blind spot for them. Heiken Ashi systems, for example, seek to mitigate this and promote trading discipline. complements other tactics nicely. Heiken Ashi signals can be used in automated trading methods.
The Heikin-Ashi Technique’s drawbacks
Because the Heikin-Ashi indicator bases its base signals on historical prices, there is a time lag at play. The majority of traders utilize price gaps to assess price momentum, initiate trades, or place stop-loss orders. Although Heikin-Ashi does not have price gaps, traders can get around this restriction during a trading session by briefly switching to conventional candlesticks. Heikin-Ashi data is averaged, as a result, actual open and close prices are not displayed. For day traders or scalpers using more active equities, this might not be the best strategy.
Gaining the ability to recognize trend patterns can take some time. They don’t appear as frequently as with traditional candlestick charts because of the smoothing impact of averaging out the price data. Because they are lagging indications relying on prior price activity, technical indicators are generally restricted. Heiken Ashi is not immune to the typical issues that account for the failure of technical indicators. Trading only using technical indicators raises the risk of price fluctuation owing to fundamental factors (paradigm shift). It’s crucial to stay current on market news and developments. Every era of market momentum comes to an end eventually. This strategy cannot change that obvious market reality, and trade management is necessary to guarantee that exit points are optimized.
Summarizing trade signals using Heikin-Ashi
A robust rise is indicated by hollow or green candles without any lower “shadows”: let your gains soar! You might wish to increase your long position and reduce your short position if you see hollow or green candles, which indicate an uptrend. Risk-taking traders may buy or sell at these candles, while others will hold off until they have confirmation before going long or short. These candles have a small body and are surrounded by upper and lower shadows, signaling a change in trend. You might wish to increase your short position and reduce your long position if you see filled or red candles, which suggest a downtrend. Strong downtrends are indicated by filled or crimson candles with no higher shadows; hold short positions until the trend changes.